Import of connection lists or KBL data
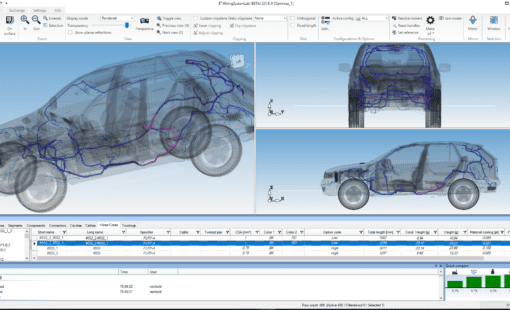
E3.ConnectivityBrowser is a technology available within the E3.series product family, which allows existing connection information to be automatically visualized as circuit diagram representations. E3.ConnectivityBrowser is an innovative solution from Zuken that allows the visualization of circuits for specific use cases. Using the connection data available in E3.series or connection information imported via a wire list, the required sections of a circuit can be prepared and displayed graphically in a fraction of a second.
Import of connection lists or KBL data

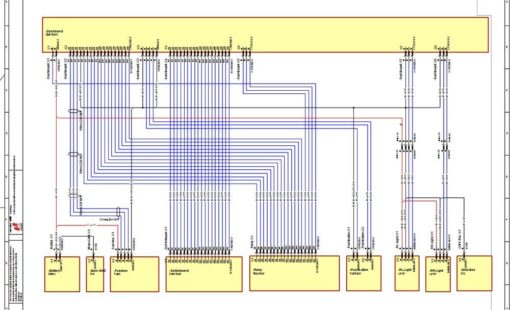
Consistent and standardised circuit diagram visualization

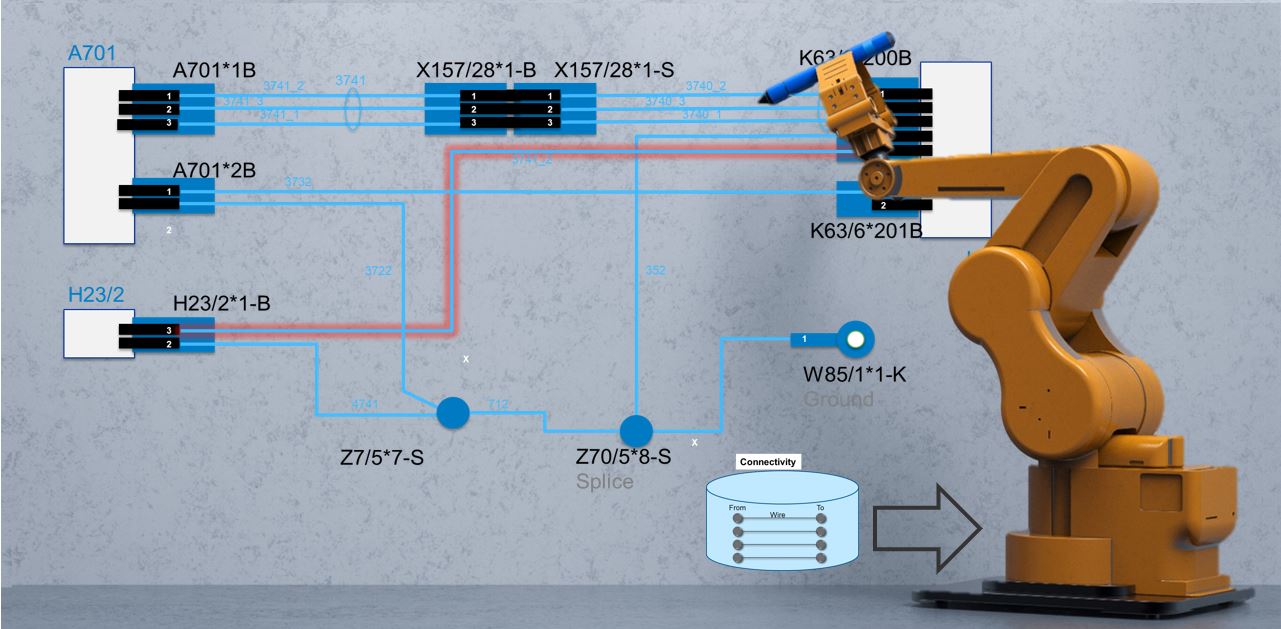
Verification and troubleshooting in service operations

Step-by-step and logical investigation of the design
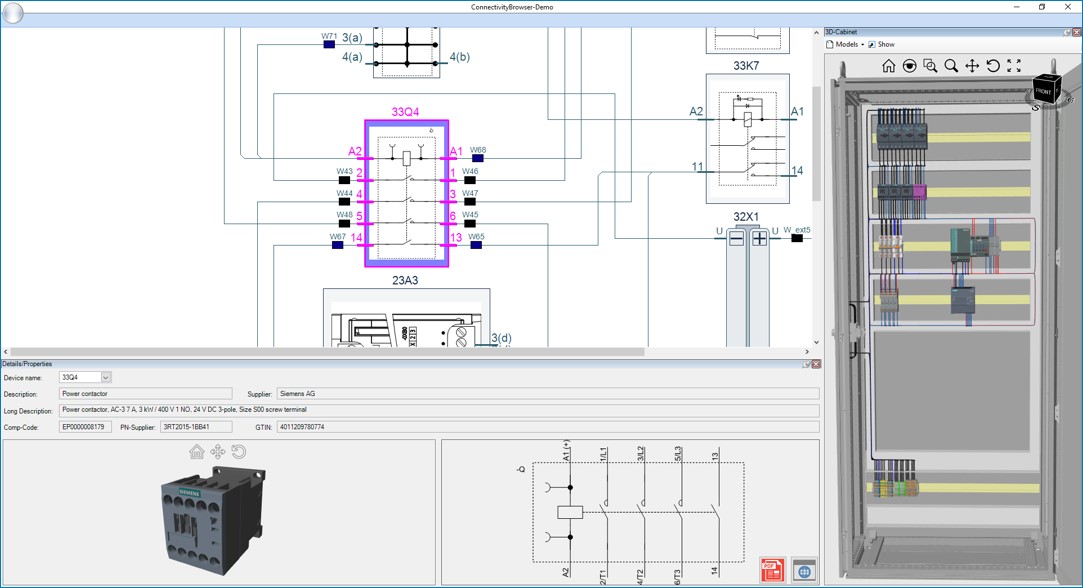
The digital connectivity model is used directly for the visualization. This enables the representation to be generated in a way that meets the needs of individual users and use cases. Complex relationships can be be visualized transparently and “on-the-fly”. Additional component attributes, connectors, pins, or wires can be visualized in dedicated information windows.
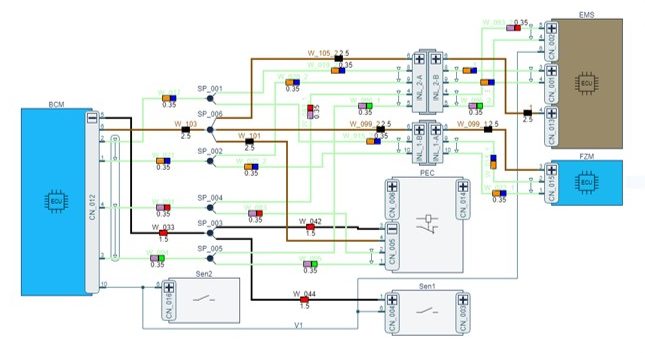
In addition to the basic visualization, the E3.ConnectivityBrowser also offers various analysis functions such as cable harness, functional, or signal consistency analyses. These help users identify design errors during release processes. Users can switch between a physical representation of a circuit diagram (e.g. separation points, ground points, etc.) and a purely logical visualization at the network level.
A cloud-based application provides numerous opportunities, e.g. the distribution of circuit information within a service organization. The web implementation of E3.ConnectivityBrowser supports these tasks in a perfect way. The data from the authoring system can be made available online to the service technicians via a server in an intranet or via the Internet, and they can access it using a standard web browser.
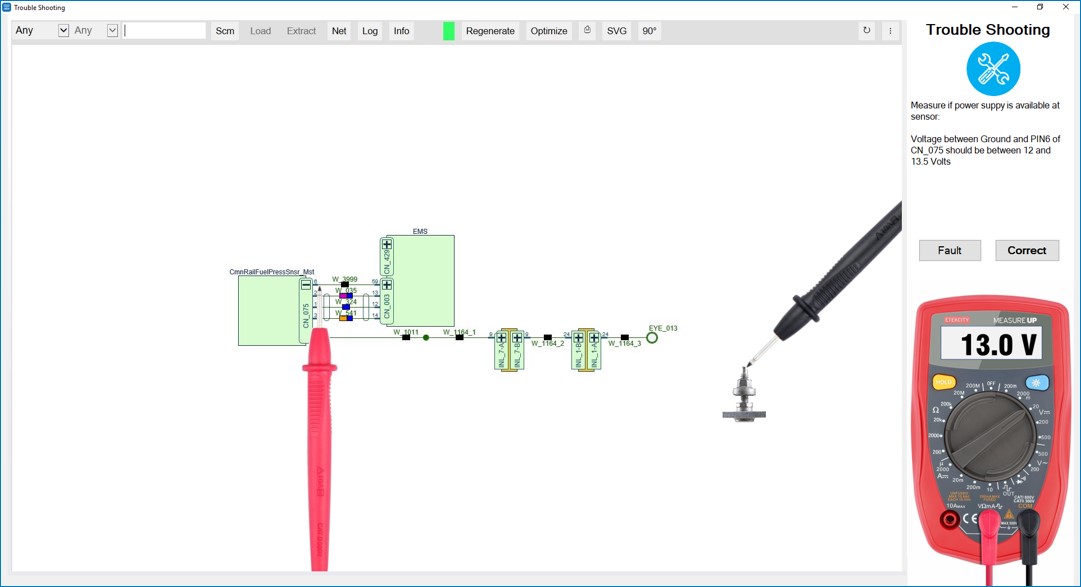
Especially in a service scenario, it is important to display exactly the data that corresponds to the device or system that needs to be repaired. In addition to this, the data should be reduced to the relevant circuit diagram context, so that service technicians receive the information they need, without having to work their way through a static set of documents. The troubleshooting process can be additionally optimized by a direct link to diagnostic equipment
Related Resources
In many use cases such as design analysis or field maintenance and repair, it is important to have access to exact schematic data and configurations. This webinar will explain how existing connection information to be automatically visualized as circuit diagram representations.
In the light of recent digitisation initiatives, circuit documentation has also come up for discussion. Specifically, the question arose as to whether or not a separation between circuit definition and visualization would make sense. In other words: wouldn't it be a great idea to store electrical data as a digital model, and to display it in a way that is suitable for each target group?
Related Products
Sharing comprehensive harness design models and documents with internal or external project teams.
E3.cable extends the functionality of E3.schematic enabling individual conductors to be combined together in the design to form cables and harnesses.
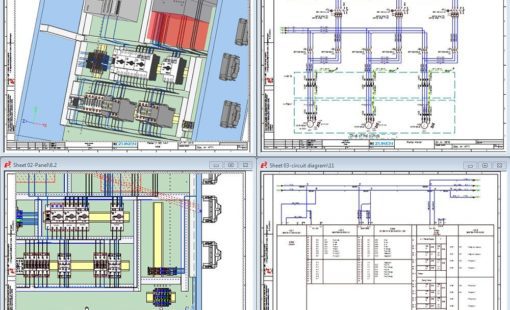
E3.panel allows engineers to layout components inside panel enclosures in both 3D and 2D. Intelligent automatic snapping points allow parts to be easily placed in their correct location.
E3.series is a true concurrent electrical engineering environment supporting advanced requirements for electrical documentation, cabinet and wire harness design and manufacturing outputs.